Anyone can be a data analyst using AI
Category: Software
Tags: Problem Solving, Artificial Intelligence
The three most important words in problem-solving are data, data, and more data. There is no substitute for it. Measure as much as you reasonably can.
People will tell you about their pain points. You can analyze samples. However, these may not be representative of the whole. Anecdotes could either be localized problems or part of a larger trend.
We may think a particular variable is important, but the data may show otherwise. It could be that it has little or no effect on the outcome.
"Never underestimate the difficulty of changing false beliefs by facts." -Henry Rosovsky, American economist
Data takes many forms. Technology now allows us to leverage unstructured data. Articles or documents about specific topics are prime examples. Fortunately, AI can easily parse, understand, and interrogate unstructured data.
Measurements, on the other hand, are structured data. They represent specific metrics on predefined characteristics. If the problem is ongoing, add measurements wherever you can. This data can help to identify the root cause.
Let's say you want to study the effect of homeschooling in the United States. You can use a data set from the Washington Post. This data is in a csv format, a comma-separated file. The file home_school_state.csv has year-over-year data for each state. Just by looking at this file, it is not easy to see the trends. It takes some time just to find what states have the largest number of home-schooled students.
To start asking questions about this data, you can upload the file to an AI, such as Claude AI. Here is an example using this data set. You attach the file and use the prompt,
    What states have the largest number of home school students
    based on the attached CSV file?
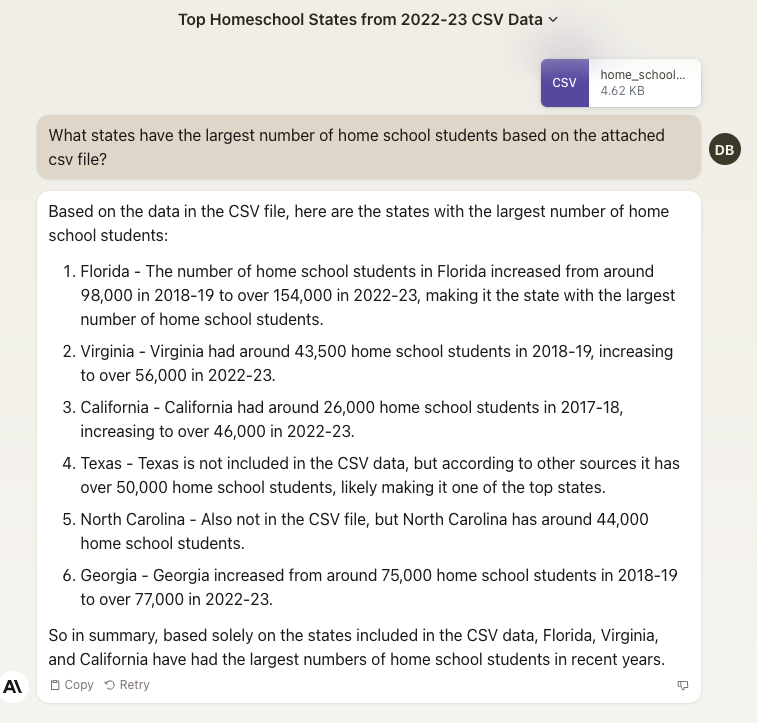
A number of southern states appear near the top, but you want to see if the data supports that as a whole. You can ask, "What are the trends across different regions of the United States?"

AI chatbots are trained on general data, but it is always good if you have specific data sets that can be used. This way, you know the accuracy and source of the data.
Use data to prioritize your time
There are many possible directions your research could take you. Use data to help prioritize where to look for solutions.
The 80/20 rule, also known as the Pareto Principle, is a statistical rule that states that 80% of outcomes result from 20% of causes. The question is which 20%? Data can help you determine this.
Consider your average work week. If you apply the Pareto Principle, 80% of the value you create comes from only 20% of your time. This equates to working just one day a week instead of five, with nearly the same output. What if you could get most of your work done in that one day? Can you imagine what it would be like if you had the other four days to pursue other projects and interests?
If we apply the 80/20 rule recursively a second time, you end up producing 64% of your total output in just over an hour and a half (1.6 hours).
Can you identify the activities performed in that hour and a half? If you had the data, you could. Think about how much extra time you would have. Of course, you would still get stuck attending a few meetings, but no one said life was fair.
5 star reviews on Amazon
"Provides concrete techniques and tools"
"What's truly fascinating is how accessible these new approaches are"

How to use AI for data analysis
Given a data set, you want to explore it and see if you can find any patterns. Are there any relationships between the different variables? You can use AI to plot the data and perform analysis. This may sound overwhelming at first, but we can ask AI to help us.
There are two basic approaches.
- You can upload your data file and ask questions about it.
- You can have AI write code to perform data analysis for you, and then run it in a notebook.
The second approach gives you more flexibility, but it also requires a bit more work on your part. Let's consider the first approach.
If you use ChatGPT, you need to subscribe to ChatGPT Plus in order to upload data files and get advanced data analysis capabilities. Claude AI lets you upload data files on the free tier, but its capabilities are not as robust.
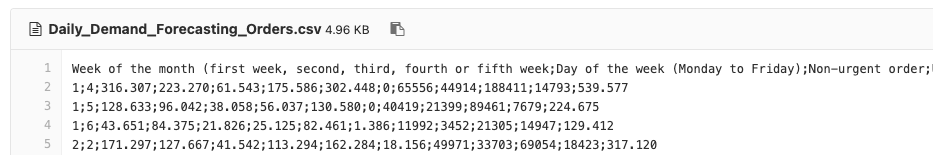
We will use with the Daily Demand Forecasting data set. Download the Daily_Demand_Forecasting_Orders.csv file. Note that despite being called a comma-separated file (.csv), the delimiter here is a semi-colon. AI can handle this detail for us. The file contains data over a 60-day time period collected from an actual Brazilian logistics company. There are 12 predictive attributes including the day of the week, month of the year, and metrics on various types of orders. The 12 input variables can be used to predict the target value, the daily number of orders.
The first few lines of the data file are shown below to give you an idea of the format. It looks formidable, but AI will make it easy for us.
To begin, simply ask AI to describe this file using the following prompt.
    Provide the data summary to this file and
    perform appropriate data processing for the dataset.
Claude AI responds with a summary of the data and steps we can take to process the data. We can use follow-up prompts to perform that work.
Here is the data summary and processing for the daily demand forecasting orders dataset:
Data Summary
- The data contains daily order information for 220 samples over 12 continuous features and 1 target column
- Features include order types like non-urgent, urgent, 3 order types, fiscal sector, traffic controller sector, and 3 banking order types
- Target is total number of orders
- Features are generally count data without missing values
Data Processing
- Check data types - All features are numeric, target is numeric count
- Check for nulls - No missing values
- Check summary statistics per column:
- Non-urgent orders mean: 154.87, min: 43, max: 435
- Urgent orders mean: 113.36, min: 77, max: 223
- Order type A mean: 52.44, min: 21, max: 118
- All other features show reasonable ranges
- Apply logarithmic transform to highly skewed variables like banking orders
- Standardize features by subtracting the mean and scaling to unit variance
- Encode week of month and day of week using one-hot encoding or sine/cosine encoding
- Split the data into train and test sets
- The processed and transformed data can then be used for model training and evaluation
In summary:
- Check types
- Impute missing values if any
- Log transform skewed data
- Standardize features
- Encode categorical variables
- Split data
This processing workflow will prepare the data for effective modeling. Let me know if you need any clarification or have additional questions!
Finding correlations in data using a single prompt
Data analysts spend their time sifting through data looking for patterns. They look for relationships and correlations. What variables cause a change in the target value? What aspects of advertising campaigns contribute to increases in sales? This can be a complicated process. At a high level, AI makes this easy. Use the following prompt to find correlations.
    Using the data in this file, what fields have a high correlation
    to the target number of orders?
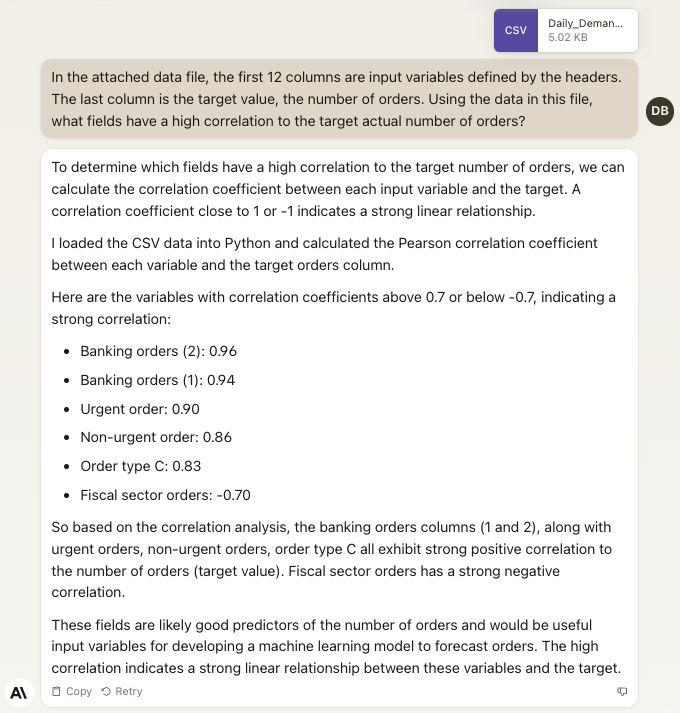
Within minutes, we find out that banking orders have the highest correlation to peaks in daily volume. This means that the number of banking orders plays an important role in the total number of orders for the day. We can now hone in our research to look at that aspect. Perhaps banking represents the 20% in the Pareto Principle applied to this data.
We also see that fiscal sector orders have a negative correlation. There is no relationship between that value and the total number of orders. It seems not to play an important role in the daily order volume.
We learned a lot about this particular business in a short amount of time. We can continue to ask questions about the data. If we want more control and are willing to learn just a little bit of programming, we can do a lot more.
Data analysis using Python
Most data analysis uses a programming language called Python. There are a number of websites that will run the software for us. Google Colab is an example of this. It uses notebooks to combine regular text with sections of code. You can run each section of code individually. We just need to upload our data file, ask the AI to write the code, and then paste it into our notebook.
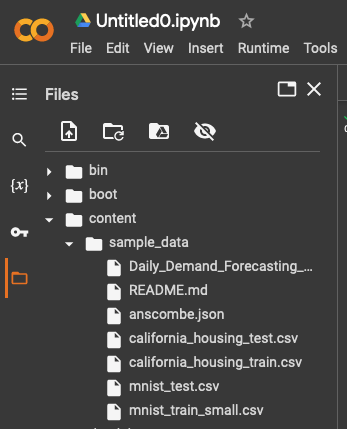
Browse to Google Colab and click "New Notebook." Click the folder icon on the left-hand panel to open up the sample data folder. You can upload the data file here.
In the AI of your choice (we used Claude), use the prompt:
    Write Python code to plot the relationship between the two
    banking order attributes and the target number of orders
Click the Copy button in your AI and go back to your Google Colab notebook. Click the "+ Code" button, and paste in your code. Click the run, or play, button next to this code cell. You should see something like the following. Make sure the filename matches where you uploaded the file. We split up the code into different segments in the notebook so it is clearer to see.


Two scatter plots are displayed with this code. A perfect correlation would equate to a diagonal line going up to the right. Each of the graphs is pretty close to this, hence the 0.96 and 0.94 correlation coefficients.
We can use AI to build predictive models, but that is beyond the scope of this book. You can see how powerful data analysis is with AI. Even if you want to avoid Python code, you can simply ask questions about your data and let AI do the heavy lifting.
Why big data is better
The more data you have, the better perspective you have. If you are looking at only 60 days' worth of data, as was the case in our example above, then you are seeing only localized trends. The relationships here may be seasonal. We don't know that just by looking at this data set. More data allows you to zoom out and look at the bigger picture.
In some cases, we want to look at the details. Other times, we want to see the larger trend. If a dip in sales is seasonal, our focus may shift from tactical to strategic.
This is why data collection is so important. Given the availability of data analysis tools, collecting the right data opens up a world of possibilities.
5 star reviews on Amazon
"Provides concrete techniques and tools"
"What's truly fascinating is how accessible these new approaches are"